
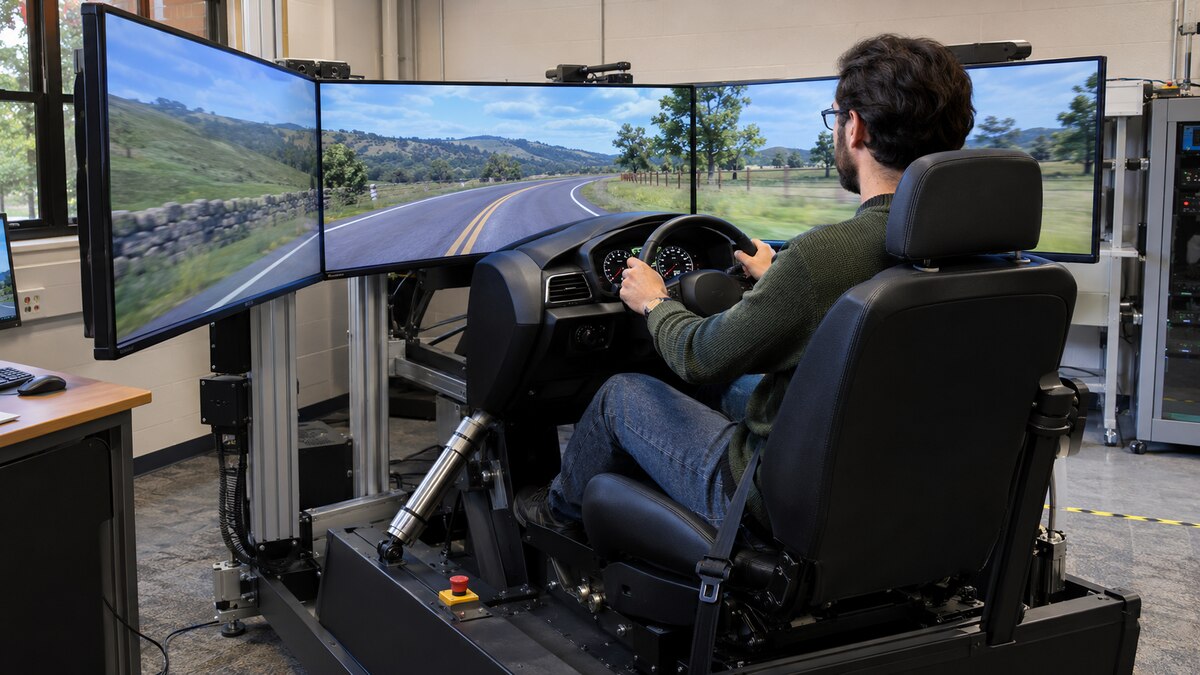
Two drivers take the same virtual road and finish with the same average speed. One holds a steady line near the center of the lane. The other spends the trip edging toward the shoulder and correcting sharply toward the middle. A speedometer would give them the same report card. The road itself would tell a different story, if only a road could keep notes. A driving simulator can.
A lane becomes a long series of numbers
At each moment in a simulated drive, a computer knows where the vehicle sits relative to the lane. It can measure the spread of those positions over time. Researchers often call this quantity the standard deviation of lateral position. A larger spread generally describes more weaving. Investigators have also used lateral position in an on-road trial with THC and CBD, where the lane markings belonged to a real highway. It says something different from average position. A driver who consistently hugs the right side may have a small spread despite being well away from the center.
In a randomized trial of edible cannabis and simulated driving, investigators examined several aspects of performance after participants received THC or placebo. The measurements included how consistently drivers held their lane and speed. Treating those as distinct outcomes matters. A volunteer who eases off the accelerator may be responding sensibly to feeling impaired. That decision leaves open how accurately the volunteer can steer or how quickly they can respond to an unexpected event.
A surprise that happens on schedule
The great convenience of a simulator is that an identical hazard can appear for different drivers. Imagine a vehicle ahead braking at a predetermined instant. The program can record when a participant starts to brake, how closely the cars approach and whether the driver swerves. In traffic, it would be difficult and dangerous to arrange for every driver to meet the same hazard under the same conditions.
The price is familiarity. On a second visit, someone might expect trouble at the bend where a vehicle stopped last time. Researchers can vary the route, include practice drives or change the order in which people receive THC and placebo. Each choice has a cost. Changing the route may give one group a harder drive. Repeating it may reward a good memory. A well-described experiment tells readers enough about the route to judge that trade-off.
The dashboard cannot see a decision
The car records a participant’s actions. It does not record why the participant chose them. That is one reason investigators sometimes ask people to rate their own driving or say whether they would drive in real life. A trial comparing performance with perceived safety measured both as time passed after cannabis use. Collecting the answers separately allowed the researchers to see whether confidence and performance recovered together. A single combined score would have buried that question.
Subjective ratings also depend on the alternative a person imagines. Someone who would decline a long motorway trip may feel ready to move a car across a driveway. Unless the prompt specifies a journey, two people who tick the same box might be picturing different demands. By contrast, the simulator gives both of them an actual bend to negotiate. Its precision is especially valuable for comparisons within the experiment.
From the screen to the street
A systematic review of THC and driving-related performance drew together results from many tasks and settings. Combining those studies can clarify recurring patterns, but it cannot convert a few extra centimeters of lane variability into an individual probability of crashing on the way home. A systematic review of simulator validation studies asks how well simulator outcomes correspond to performance on real roads. Weather, other drivers, road design and the decision to make the trip all belong to that second question.
Read a simulator report with the virtual road in mind. What did the driver have to do? What could go wrong? Which of those things did the machine actually count? If a paper reports unchanged average speed and greater weaving, those findings can coexist. One describes the trip from start to finish. The other describes the corrections it took to get there.